Blog ENG
Community detection at Eurovision
The Eurovision song contest is a very popular event, both inside and outside Europe, in which each participating country sends one representative who then competes to win Eurovision. The voting system has been changed constantly over the years. The most general rule for voting is that there are votes from the jury and from televoters from each country and that countries cannot vote for their own performance. In earlier years the votes from the jury and televoters were combined and distributed according to a scoring scale (1-8, 10, 12 points). As of 2016, there are two sets of points, one from the jury and the other from televoters. This is done because there is a common thought about voting at Eurovision, that “friends give friends points” and the quality of the song, performance or effort itself is not so influential on the voters’ vote. In other words, the thesis here is that countries that share geo-political interests tend to give each other more points on average.
So we decided to look at the data and by using Neo4j graph databases and the integrated graph and data science algorithms see if there is any connection between the countries and their voting by letting the algorithm determine if there are communities between them.
Setup
We used three datasets: voting from 1975-2015, televotes from 2016-2019 and jury votes from 2016-2019. You can find all datasets available here.
The datasets contain:
– the country that gave the points x
– the country that received the points y
– share (all points given by country x to country y / the maximum number of points that country x could give to country y)
We imported the data into Neo4j using the integrated LOAD CSV functions.
Community detection
To see if there is a connection between countries and their voting, we used a community detection algorithm [1]. Community detection algorithms are used to evaluate how groups of nodes are clustered or partitioned, as well as their tendency to strengthen or break apart.In this case we used the Louvain algorithm included in the Neo4j GDS library [2]. Louvain is an algorithm that is divided into two repeating phases: Modularity Optimization and Community Aggregation. In the first phase modularity is optimized by allowing only local changes of communities and in the other phase communities that are found are aggregated in order to build a new network of communities [3].
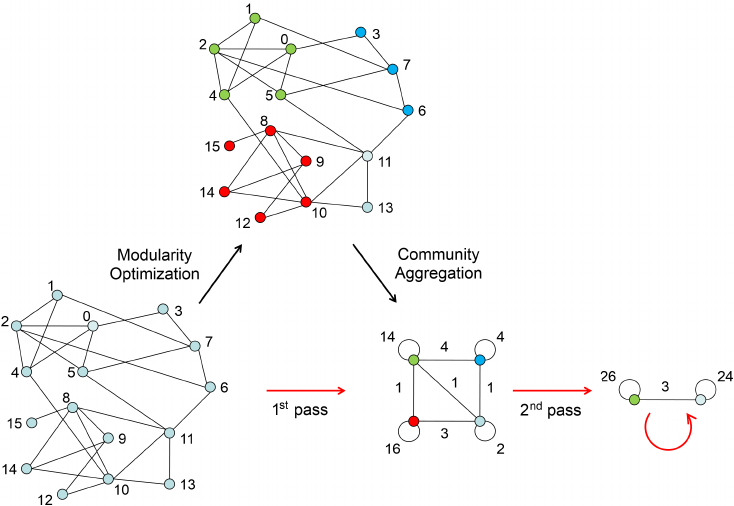
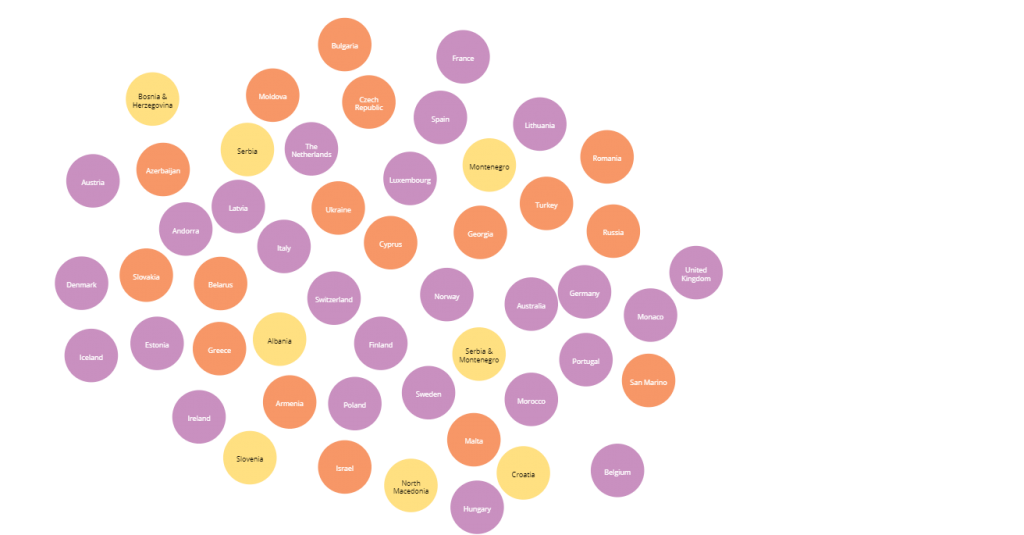
After we implemented the Louvain algorithm over the datasets we obtained the results shown below. (The figure shows the visualization of the results over the 1975-2015 dataset)
Results
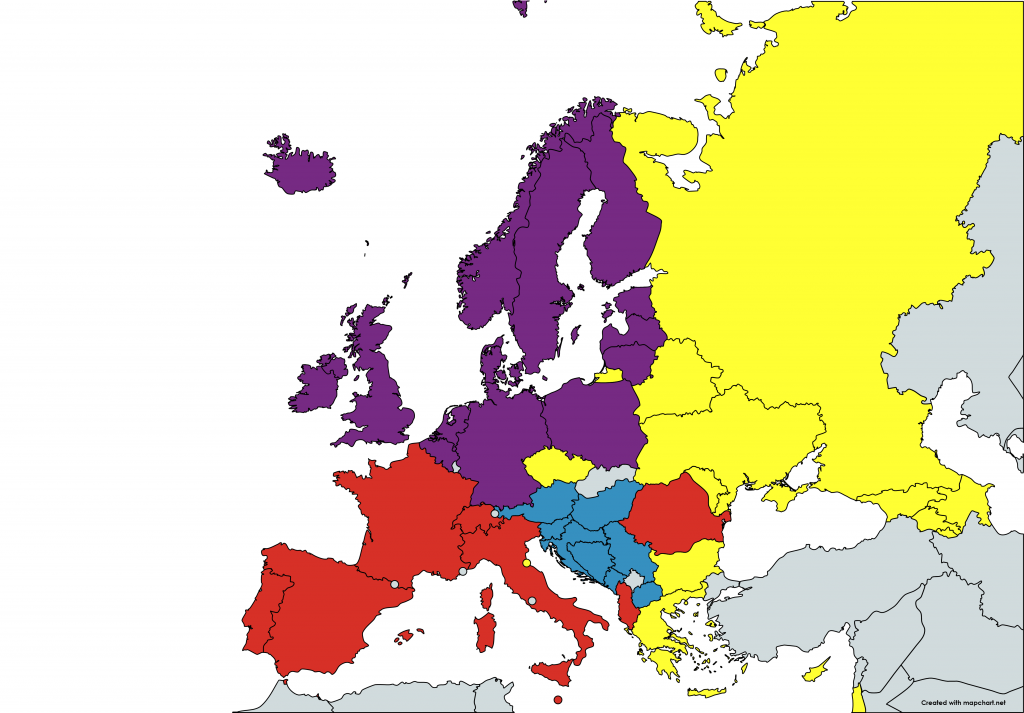
Voting: 1975-2015 – Subcategories in the intermediate step of the algorithm
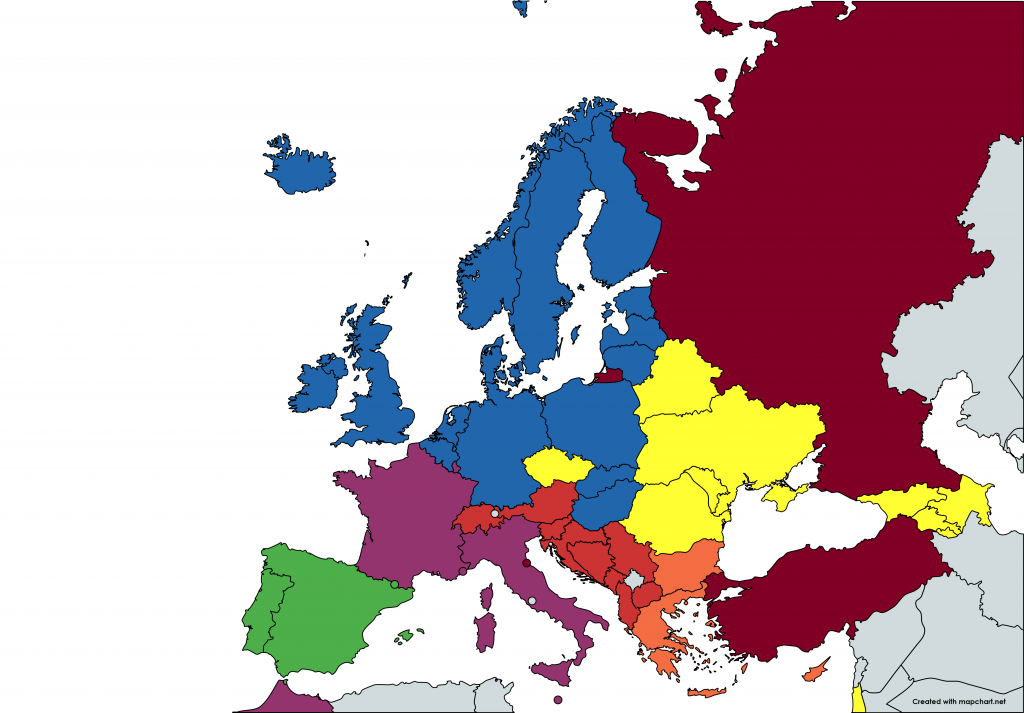
To better understand the results, we mapped them to a map of Europe. As the Louvain algorithm has multiple passes, Neo4j allows us to see all the results of the intermediate steps or communities that were calculated before the final step (as shown in the following figure for dataset 1975-2015).
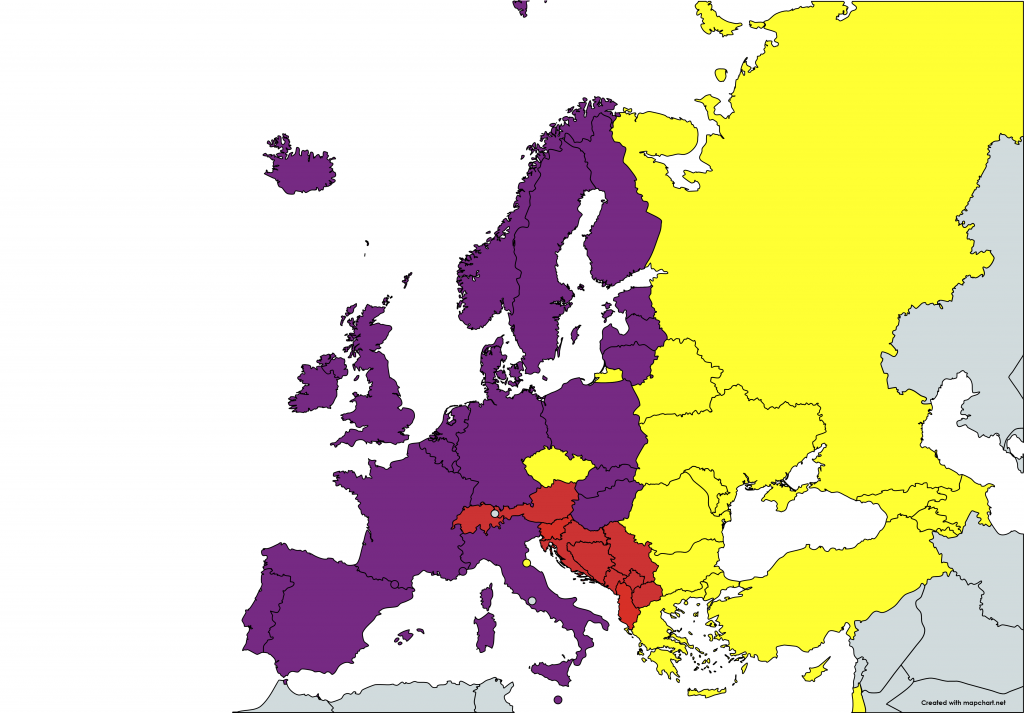
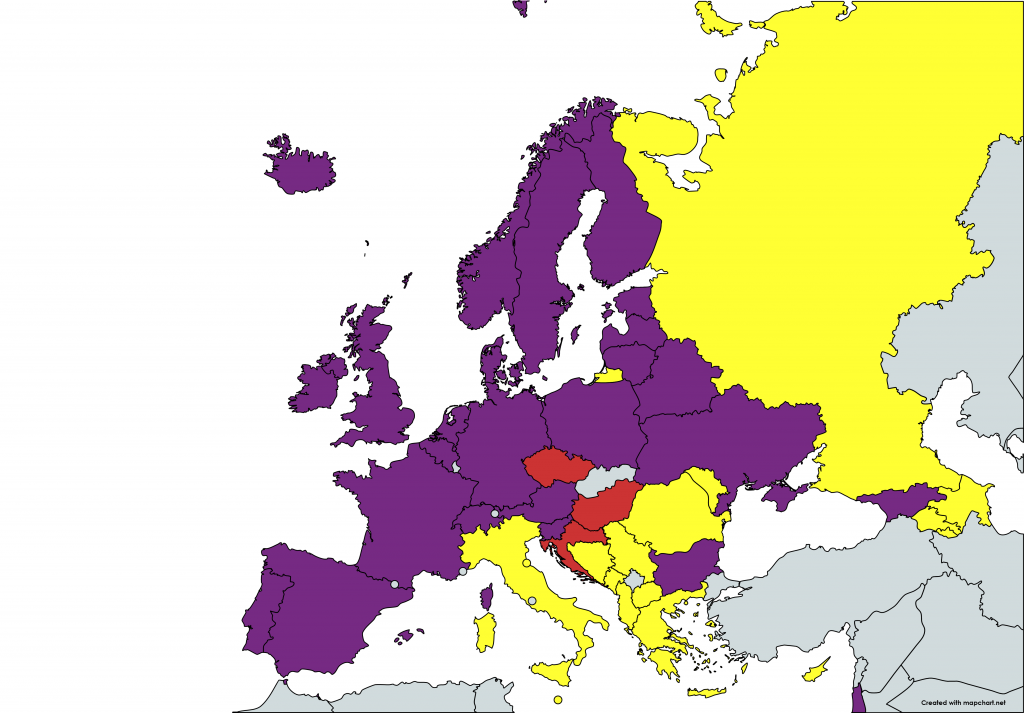
Voting: 1975-2015 – Final results
Završna faza algoritma sadrži maksimalno moguće grupirane zajednice. Nakon završne faze rezultat pokazuje da su do 2016. glasovi bili podijeljeni samo In the final stage the algorithm tries to group the nodes as much as possible. After the final stage the result shows that by 2016 the votes were divided only between three groups (Eastern Europe, Western Europe and most countries of the former Yugoslavia) although the previous step showed that there are more groups and that it is possible to divide Eastern and Western Europe into three smaller subgroups.
Voting: 2016-2019 – Televoting and Jury voting
If we show only the final results of the datasets after 2015 we see a larger division in televoting than before the division of votes. We notice that televotes are mostly influenced by geo-political relations and that there are 4 strong communities (Northern Europe, countries of mostly Romance spoken languages, most countries of the former Yugoslavia and Austro-Hungary and Eastern Europe with predominantly Slavic and Euroasian countries).
Voting: 2016-2019 – Televoting
Voting: 2016-2019 – Jury voting
Conclusion
So, was our assumption true? Computer says yes! As we can see from the resulting images (maps), there is a strong indication that countries that are close together geographically also stick together in voting, especially in televoting.If you have any questions about the technical implementation of this project, you can contact Tina Knežević (mail, LinkedIn). If you have any data science questions or want to discuss Eurovision, feel free to contact Domagoj Marić (mail, LinkedIn).
Reference
[1] Neo4j docs, https://neo4j.com/docs/graph-data-science/current/algorithms/community/ (3/11/2021)
[2] Neo4j docs, https://neo4j.com/docs/graph-data-science/current/installation/ (3/11/2021)
[3] V. D. Blondel, J.-L. Guillaume, R. Lambiotte and E. Lefebvre, “Fast unfolding of communities in large networks,” J. Stat. Mech. (2008) P10008, p. 12, 2008.