Blog ENG
Lying with data
“Research has shown”
You must have read at least once an article on a topic that you understand very well, only to be shocked at how badly it was conveyed by journalists. You have probably felt a very strong feeling of discomfort that a member of Generation Z would describe with the word “cringe”. Maybe you did the right thing after that, closed the laptop and decided that was enough Internet for today, or you (if you are a member of Generation X) left a comment in which you politely (or not so politely) explained to the said person “how things really stand”. Both reactions are human and rational.
What is not rational, but is human, is a kind of amnesia that occurs as soon as the impressions from reading the article cool down. It happens that despite the negative experience from before, we decide to take the information conveyed by the journalist for granted (especially if we are not well versed in said topic). In this way, it easily happens to us that we believe in some nonsense (fake news) that we have read. This effect was named after the American physicist Murray Gell-Mann who described it.
We could generalize the above and note that information changes as it goes from one source to another. Each source modifies it a bit. This effect is most visible in the children’s game of telephone. If there is one thing we should conclude from this chapter, it is that we should not blindly believe what we read. In the following chapters, we will try to explain what research is and what it means that research has shown something.
Lying by omission
This is perhaps the easiest way to fool a cursory reader. Of all the ways in which some information can be presented, the one that shocks the reader the most is chosen. The reader, unaware of the effect from the previous chapter, blindly believes in the information presented to him. One example of such a claim is: “If you do X, the risk of cancer Y increases by 200%.” You must have come across at least one such example. What they haven’t told you is that the initial probability of getting this type of cancer is 1: 1,000,000 and that rising to 2: 1,000,000 shouldn’t really worry you too much.
Another example of this technique is histogram cutting.
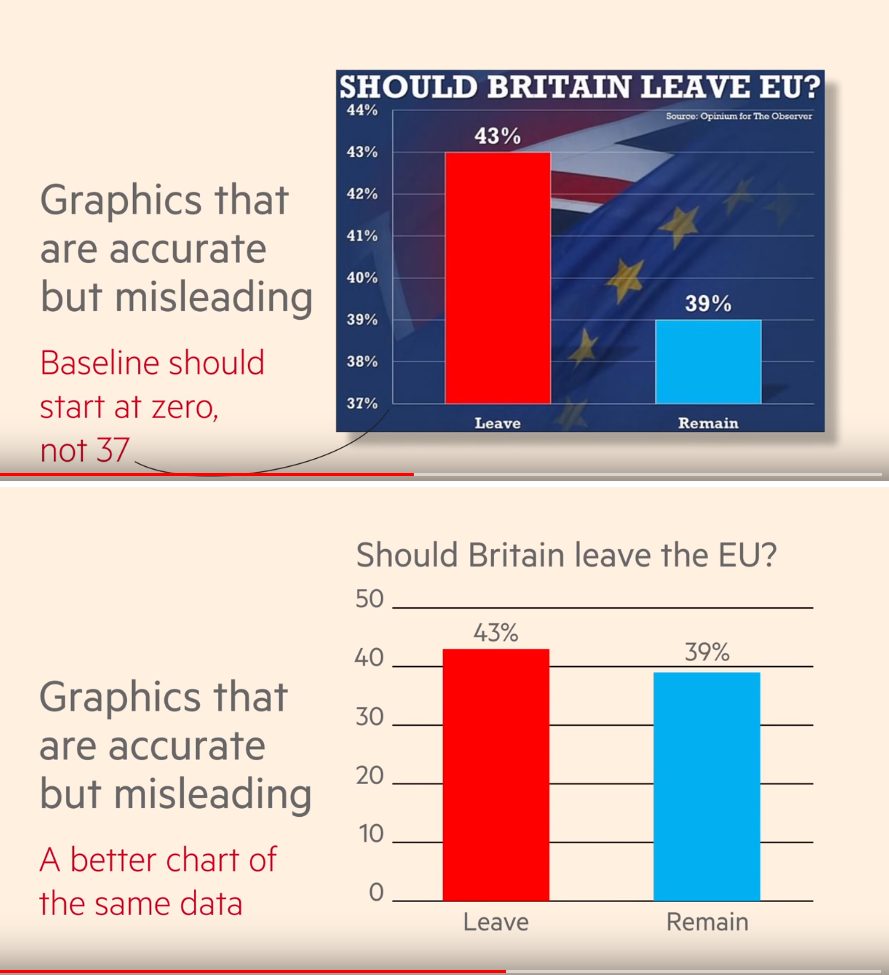
As we see in the first figure above, histograms were cut to manipulate the perception of the magnitude of difference. The second figure above shows the real situation.
It should be noted that any graph without marked axes and scales does not make much sense and should not be considered.
Correlation does not equal causation
Did you know that there is a correlation between playing violent video games and propensity to violence? Did you know that there is a correlation between coffee intake and testosterone levels in men? Did you know that there is a correlation between ice cream consumption and rising bitcoin prices? Did you know that there is a correlation between Nicolas Cage’s films and the rate of drowning in the pool?
Wondering why the claims were ordered like this? We started from one that makes sense and came up with a claim that is obviously meaningless. But they are all of equal scientific importance if their only basis is correlation. If we want to show that X causes Y, we should carefully design an experiment in which we have 2 groups of people, one doing X and the other not doing X, then we would observe the impact on the outcome of Y. We should be careful to eliminate the impact of all the other relevant variables (such as age, gender, activities, etc.).
Despite all of this, we need to beware of a slippery slope: we cannot reject all results on the basis that they are correlated. For instance, this technique was used by the tobacco industry, because all the research at the time that indicates the harmfulness of smoking was based on correlation.
Cherry picking and similar lies
In the 1940s, American epidemiologist Ancel Keys established a link between saturated fat intake and various cardiovascular diseases (the so-called lipid hypothesis). The result was a food pyramid, which is still taught to children in school, according to which meat and dairy products should be avoided. However, the validity of this study is highly questionable, as it was found that out of 21 available states, Keys used only 6 of them. When a correct analysis is done on the data collected from all the available states, the link between saturated fat intake and disease is much less clear. We have no intention of entering into dietary recommendations, but it should be noted, that the lipid hypothesis is highly controversial in the scientific community today.
Whether the lipid hypothesis is true or not, selecting data that fits our hypothesis is called cherry picking and is one of the more serious sins against the scientific methods.
Survivorship bias or accidental mistake?
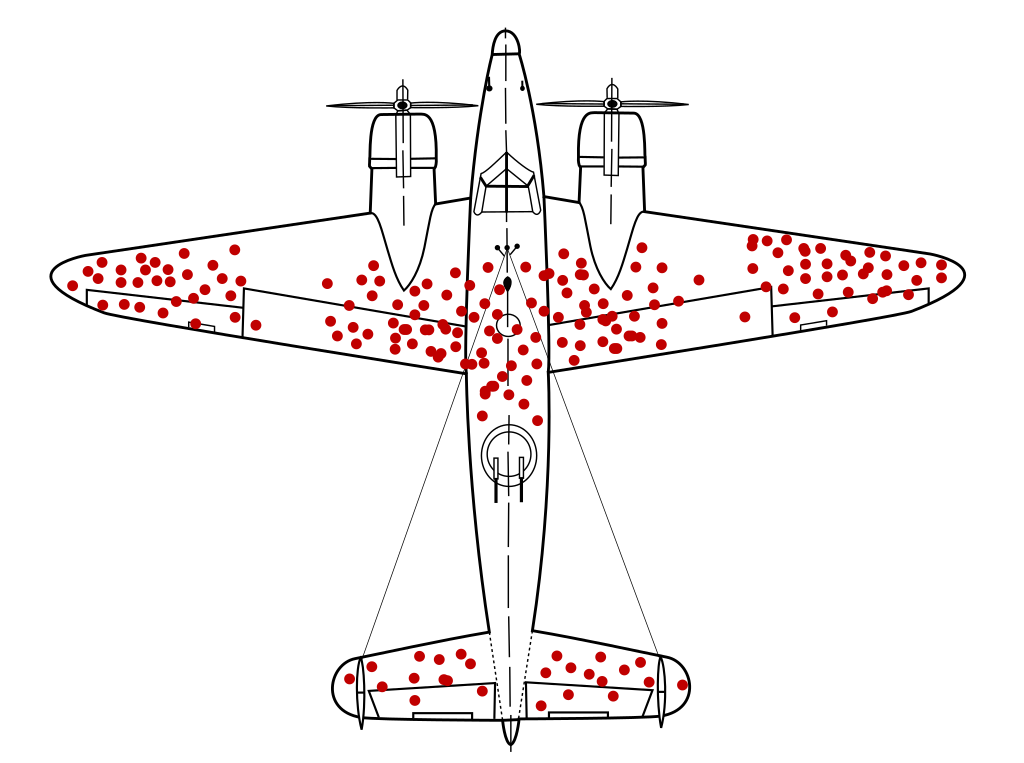
There is also a related fallacy in which unintentional cherry picking occurs. During World War II, statistician Abraham Wald was tasked with determining how to reduce the number of bombers getting shot down. His team found that certain areas of bombers were getting shot far more often. If you thickened the armor in those places you would make a fatal mistake. You forgot to take into account the fact that they only had an insight into the planes that had returned. This fact completely changes the strategy of thickening the armor, because if the planes hit in place X returned, it implies that the plane can be hit in place X. The planes hit in place Y are not in the data set, because those planes were shot down.
Therefore, the correct logic would be (as Wald’s team correctly concluded) to thicken the armor in places where no holes were found. This fallacy alone could be made a separate blog post, as it is present in many areas, from economics, law, all the way to history and biology. Due to its nature, it is known as survivorship bias.
Lying by chaining hypotheses
If you don’t know what to have for breakfast tomorrow: scrambled eggs or oatmeal, you might be even more confused after this chapter.
Take the example of cholesterol and mortality. High cholesterol levels have been found to be associated with all causes of death (heart disease, tumors, etc.). Eggs were then found to raise cholesterol levels. From this we could conclude that egg intake increases the risk of disease and death. However, for a trained eye, it is clear that we have chained 2 probabilities here. One that has to do with the hypothesis which states that a high cholesterol is harmful, and the other is that eating eggs raises cholesterol. This significantly reduces the probability of the overall claim.
There are also cases in which even more claims are chained, and in such cases the probability of truthfulness is exponentially lower. An example is the various climate models that predict catastrophic scenarios, and are based on models which lay on the various assumptions. If we look at today’s research on climate change, we will see that the predictions of some models deviate greatly, and this difference is caused by chaining numerous assumptions. That being said, there are no optimistic models, unfortunately :).
Manipulation by extrapolation
You have decided to invest in a stock of your favorite company based on its historical success? Unfortunately, you once again allowed the data to deceive you. Indeed, it is impossible to predict what will happen in the future based on past data. What we can do is observe the causal factors that cause a rise or fall in the share price and by observing these factors, it is possible to partially estimate what will happen to the share price.
Misunderstood p value
How to determine if the relationship we found between X and Y is significant? In practice, a method called hypothesis testing is used. We start with the null hypothesis which states that there is no connection between X and Y. Then a suitable statistical test is made which returns something called the p value.
The p value answers the following question: imagine that there is a universe in which the null hypothesis holds. What is the probability that we have observed a particular set of data points if we assume the data is extracted from that parallel universe? If that probability is low enough, we can be confident that we are in a universe where the null hypothesis is not true but an alternative hypothesis holds.
In practice, a significance threshold of 0.05 is chosen, which corresponds to a probability of 5%. It should be noted that these 5% were chosen completely arbitrarily and that there is no objective reason for this value. Apart from arbitrarily choosing a threshold, scientists are deterred from publishing non-significant values. Yet there is a pressure in academia for frequent paper publishing (publish or perish). Therefore, it happens that papers that show a significant relationship are mostly published, thus entering a black hole where the credibility of research decreases (see the chapter on cherry picking).
Key takeaways
From all this it could be concluded that there is no such thing as too much knowledge. One must not blindly believe what one reads. It is necessary to study the sources, methodology and whether they are in agreement with the conclusions. It is also advisable to try to find hidden motives and agendas of those who place (mis)information. Finally, we would like to add that sometimes it is necessary to trust our own intuition, it exists for a reason, and that is that we can make decisions based on a limited source of information. Of course, if you want to get properly informed I would recommend you to read other articles from our blog.
References and further reading
D. Huff, How to Lie with Statistics – A classic in this field.
E. T. Jaynes, Probability Theory: The Logic of Science – An excellent book for learning the concepts of statistics and drawing conclusions based on data.
P. Feyerabend, Against the method – An interesting philosophy of science book, which will shake up previous beliefs in the scientific method.