Blog ENG
Neo4j for Telecoms
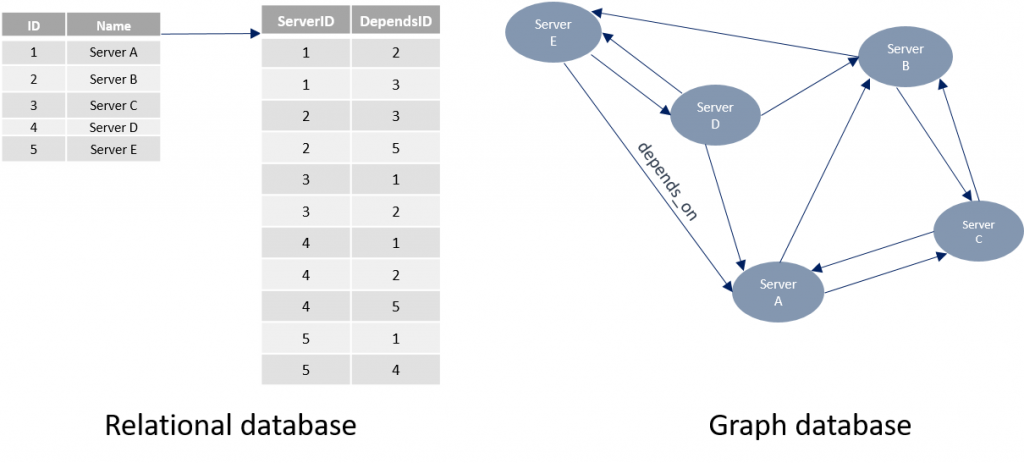
Databases can be divided into those that use Structured Query Language and those that don’t, a.k.a. NoSQL databases. One type of NoSQL database are graph databases. A graph database is based, as the name suggests, on a graph. The graph contains nodes and relationships between these nodes, also nodes and relationships may have additional attributes called properties that describe them in more detail. What sets a database graph apart from other databases is its efficiency in processing highly related data and easy execution of queries. A graph database is based on the relationships of neighboring nodes and thus facilitates collection and information aggregation over millions of nodes and relationships.

Neo4j
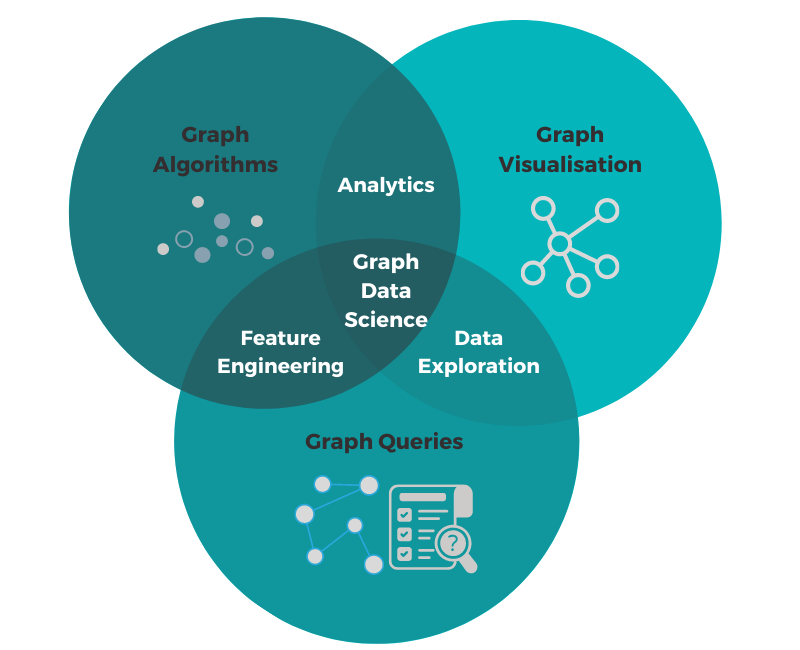
Neo4j is an open-source, NoSQL, graph database that provides an ACID-compliant transactional backend with native graph storage and processing that has been publicly available since 2007. Neo4j is a native graph database, which means that it implements a true graph model all the way down to the storage level. The data isn’t stored as a “graph abstraction” on top of another technology, it’s stored just as it is – a graph. That is why Neo4j outperforms other graph databases and stays so flexible. Neo4j provides ACID transactions, cluster support, and runtime failover. This stability and maturity is why it’s been used in production scenarios for large enterprise workloads for years [1]. Also, it should be noted that Neo4j provides various additional functionalities such as data science algorithms that make it possible to very easily detect additional data values that are hidden in their interconnections.

Telecommunication industry
Telecoms are one of the industries that have turned to graph databases in various aspects of their business. The development of this industry increases the complexity of monitoring and improvement of the functionality of its processes. If we consider that the existing infrastructure is mixed with concepts such as network functions virtualization (NFV), software-defined networks (SDN), and significant automation, monitoring services at each individual layer of communication becomes extremely difficult. Because traditional solutions are often too hierarchical and not flexible enough to keep up with today’s complex and dynamic networks, telecom providers are forced to turn to new, scalable solutions that can provide services that will help them in real time and very easily detect impacts on end users so they can react in time. Telecoms are turning to solutions that accurately reflect and allow easy visualization of their highly interconnected systems and services that often come from different sources [2].
The Network is a Graph
If we look at the network representation of a telecommunications system, we can see that it is indeed a graph that has different nodes and connections between them. Nodes are actually systems and services, from physical items (such as routers, servers, switches), software solutions (applications), to activities (user calls, media transfers) and customer information (such as rights and subscriptions). All this information comes from different sources, and is interconnected and interdependent. That is why a graph representation of this topology allows for a better understanding of the interconnectedness of components and allows us to monitor the flow of information in such systems as we present them as they really are, networked [2].

Neo4j, the world’s most relied upon graph platform, naturally captures relationships between data and therefore easily models network and service complexity. This emphasis on connections is unlike relational databases (RDMS) that require careful schema development and complex joins to map multiple levels of relationships, which are then inflexible when adding new data. Furthermore, service assurance requires performance and predictability, such as monitoring real-time end-user experience for automated response. Because of its native graph storage Neo4j thrives in querying such complexity at scale, easily outperforming RDBMS and other NoSQL data storage [2]. Due to this fact, the use of graph databases in operational support systems, used to manage and design the network and monitor the interdependence of network components as well as early detection of problems and timely response, is very common. Also, in addition to operating systems, it is often used in business support systems to monitor customer-related information.
Neo4j in action
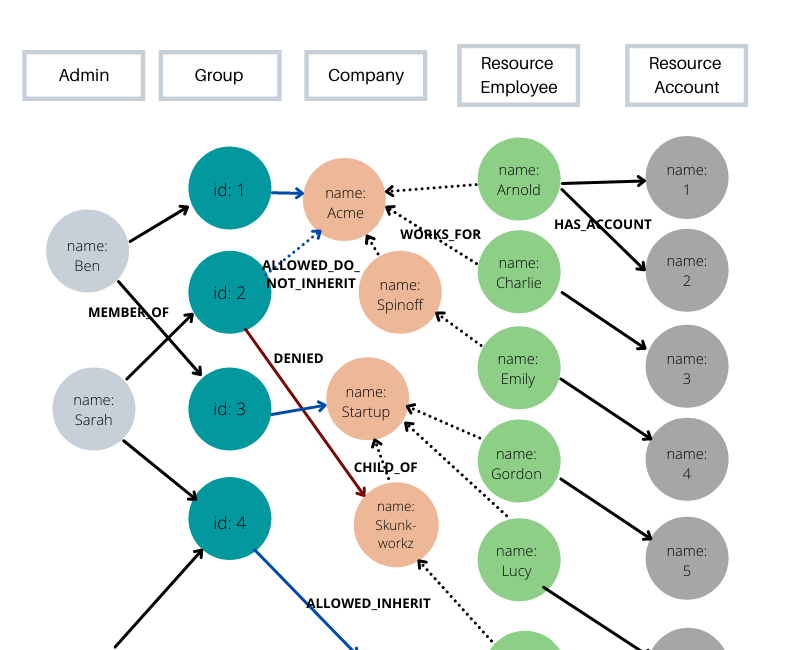
One real example of using the Neo4j graph database is in churn analysis to see user outflow. For the purpose of such analysis, it is possible to monitor connection of users through their mutual calls within the same network using a graph database. This allows for a timely response to users close to a user who has quit the service to prevent further outflow of users. A specific example of the use of Neo4j graph database in practice, used by Telenor, is in a system that allows business users to manage subscriptions and plans within them. As the number of users grows, the complexity of the system itself also grows, and in the traditional relational approach, for companies with a large number of users who use different subscriptions, the authorization of such a system would take over 20 minutes. On the other hand, modeling the system through a graph database solves this problem since the graph naturally shows relationships between users and their subscriptions as well as the structure of access privileges and subscription management capabilities. In this way, timely access to the system with the latest data is ensured.

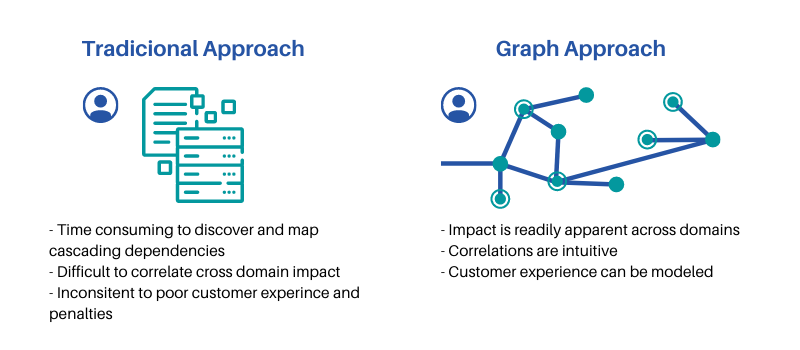
Another example of the use of the Neo4j database is in the network management and control. One of the benefits of graphs in network control is the analysis of the impact of component failures on the system. Using graph databases, it is very easy to monitor the interdependence of components and react in a timely manner to possible outages, informing the user about possible difficulties and redirecting network traffic. In this way, service providers reduce the risk of potential penalties in the event of unexpected interference and inability to provide the service. Also, one of the essential roles of graph databases is in master data management. Service providers have many users, business and private, and also provide many services that often have different plans and options. The amount of data monitored is becoming more and more complex, and by using graphs it is possible to easily and timely monitor patterns of user behavior and thus profile users and offer them services tailored to their needs. Graph databases are used to create knowledge graphs that allow for the creation of logical connections between a number of related concepts in order to obtain the desired information as quickly as possible. Such knowledge graphs are widely used in helpdesks and sales centers of large telecoms because they allow employees to quickly access information related to users and services and thus speed up and improve their business processes.
Conclusion
Graph databases have become a very popular choice for managing complex systems in the telecommunications industry precisely because of their very intuitive and flexible adaptation to the structure of such systems. Graph databases have proven to be successful in managing operating and business systems, but also in Internet of Things management, fraud analysis, and regulatory compliance analysis. Numerous telecommunications companies and others involved in computer networking products such as Norway’s Telenor, Germany’s Telecom and US-based Cisco Systems have turned to graph databases to improve and enhance their businesses. It is to be expected that the popularity of graph databases will continue to grow with further development of the telecommunications industry and all business aspects related to it.
References:
[1] What is Graph Database?, https://neo4j.com/developer/graph-database/
[2] Amy E. Hodler, Optimize Network Services, neo4j.com
[3] Jim Webber, The Top 5 Use Cases of Graph Databases, neo4j.com

