Blog ENG
Computer vision goes to the store
It has been estimated that 76% of all shopping decisions are made on the spot. Naturally you could assume that most of the shopping is done impulsively, which is precisely the assumption manufacturers and distributors rely on when investing heavily in this final sales step. Retail execution is a term that describes the optimization of these processes in order to maximize the sales and it is most commonly used in the context of FMCG (Fast Moving Consumer Goods).
There are several challenges retail execution tackles:
- detecting missing items on shelves (out-of-stock detection)
- share of shelf
- planogram compliance
Detecting out-of-stock items
Say you have decided to go to the store and buy yourself your favorite sparkling beverage. What you did not expect is to see your favorite beverage out of stock, in which case the second best option is most likely going to be a beverage from a competing company. In order to prevent this scenario from happening, manufacturers and distributors need to make sure that stores restock their products regularly. Usually this is done by hand, i.e. travel agents visit the stores to check if any restock is needed.
Monitoring competitive product share
When manufacturers launch a new product they negotiate certain elements of product display on shelves. One of the most common ones is shelf share. Simply put, it is a proportion of one manufacturer’s products relative to all the products on the shelf. Since the shelves are arranged to contain products of the same category, from the manufacturers’ point of view, their product is side by side with the competition. Similarly to the out-of-stock problem, travel agents are sent to the stores to manually check shelf share.
Controlling compliance with the planogram
The main focus of planogram compliance is assuring that items are displayed properly and in correct positions on the shelf, unlike the share of the shelf where most of the focus is on acquiring a better position than the competition. A planogram is a detailed visual layout of positions on a store shelf. Manufacturers are obtaining facings (a facing is a shelf share that one product can occupy) on a shelf. Therefore the planogram defines where those facings are and which products occupy them. Since the position on a shelf highly affects if the product will be purchased, ensuring that the product is in its right position is a great way to cut down losses. Thus far, manufacturers are sending their employees to check if planograms match the layout in the store. That employee has to go to the store and check each shelf and item individually.
If there was a way to automate the procedure that each employee has to do it would have great benefits:
- high cost and time savings – employees would be more efficient when checking the layout
- more precise data – human error would be avoided
- instant and frequent insight of the store layout
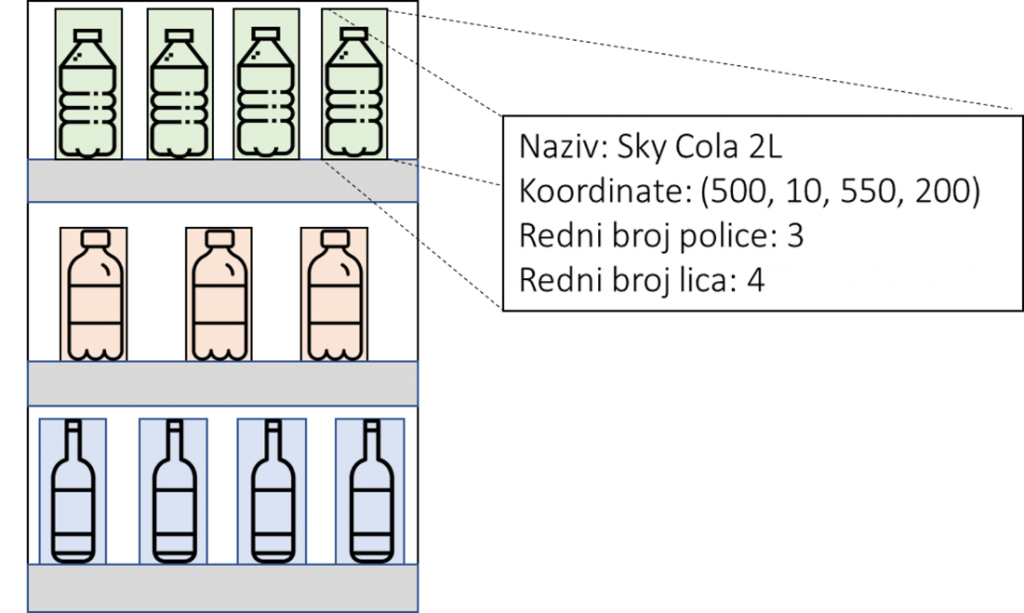
The SOVA project is an automation solution for exactly such a situation. The solution we are developing is based on computer vision technology enhanced by artificial intelligence. If provided with a photo, our solution can produce this information in real time:
- coordinates of each product on a shelf
- name of each product
- ordinal number of the shelf in reference to other shelves (the bottom shelf is the first one)
- position in a queue on the shelf (positions are assigned numbers, from left to right, in ascending order starting from 1)
- product size
The SOVA project
Commonly used terms when discussing image analysis are object detection and object classification. Mathematical models that are used to perform these tasks are called deep neural networks. If trained on a sufficient amount of data, such models perform extremely well, satisfying all the business requirements. In the deep learning domain, sufficient amount of data almost always means large amounts of data. In our case, gathering such amounts is a lengthy process, not only because it requires manpower to go to the store and take as many images as possible, but because it also requires manpower to go over those images and assign correct product coordinates and names. This process is known as data annotation.
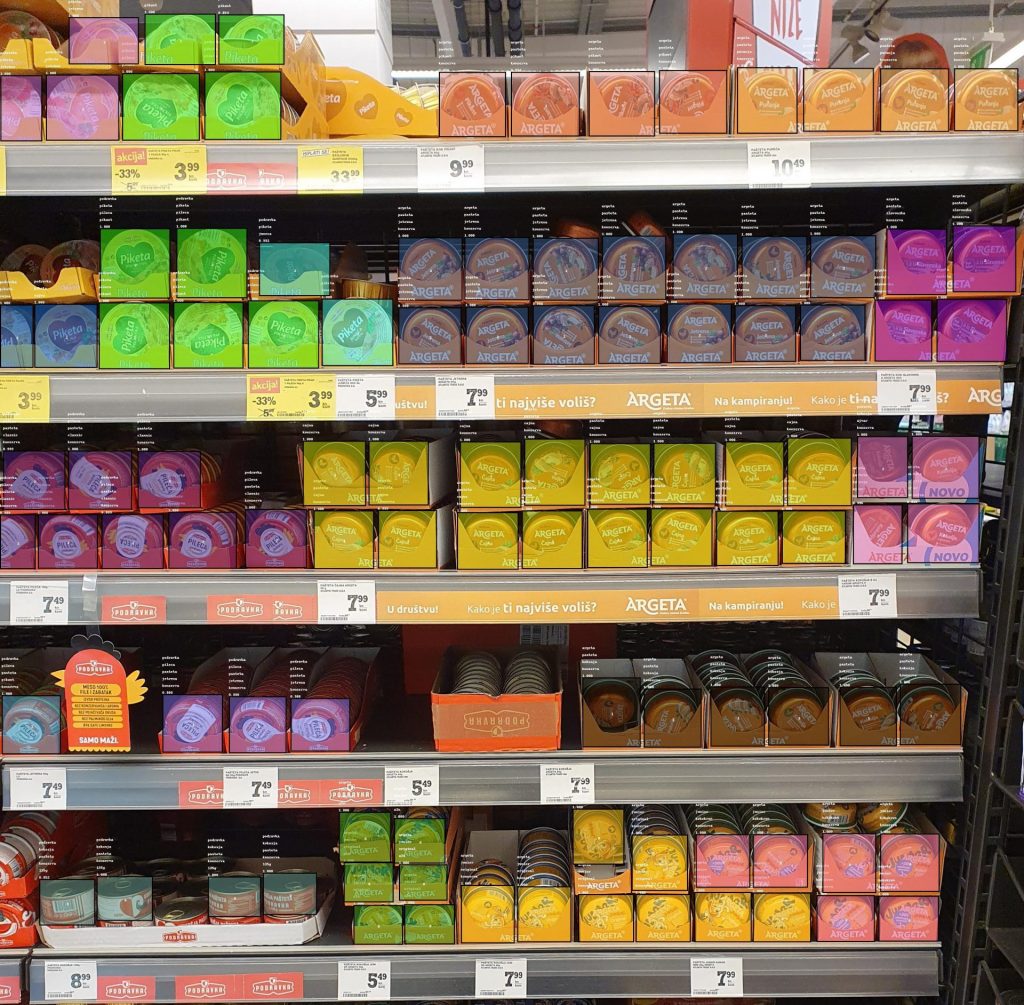
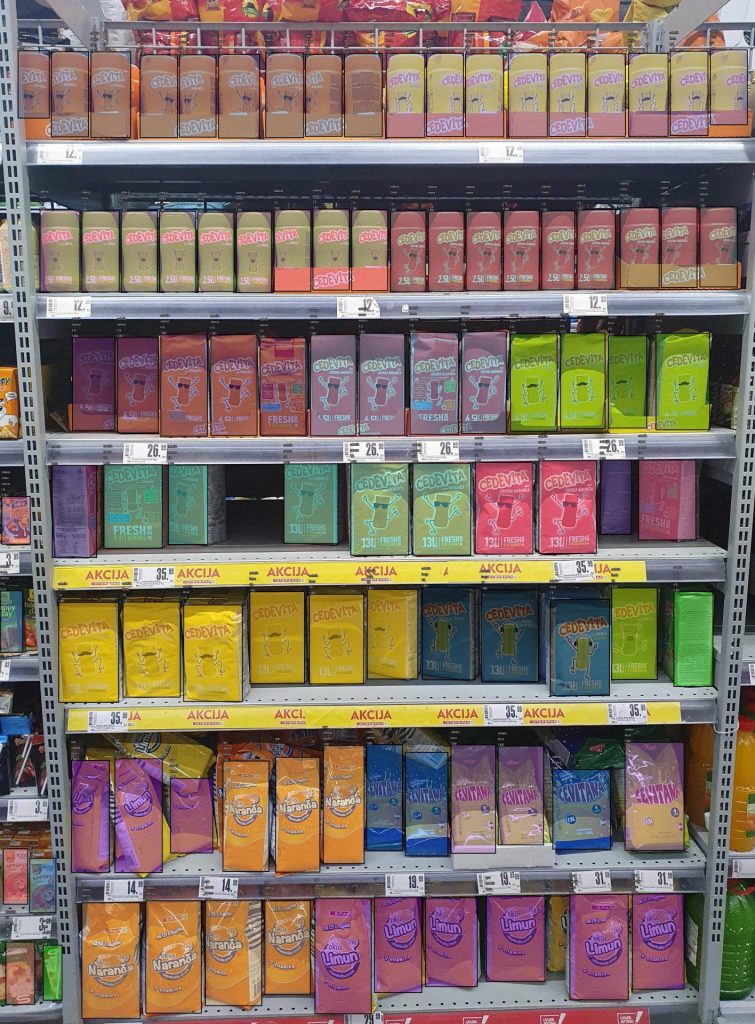
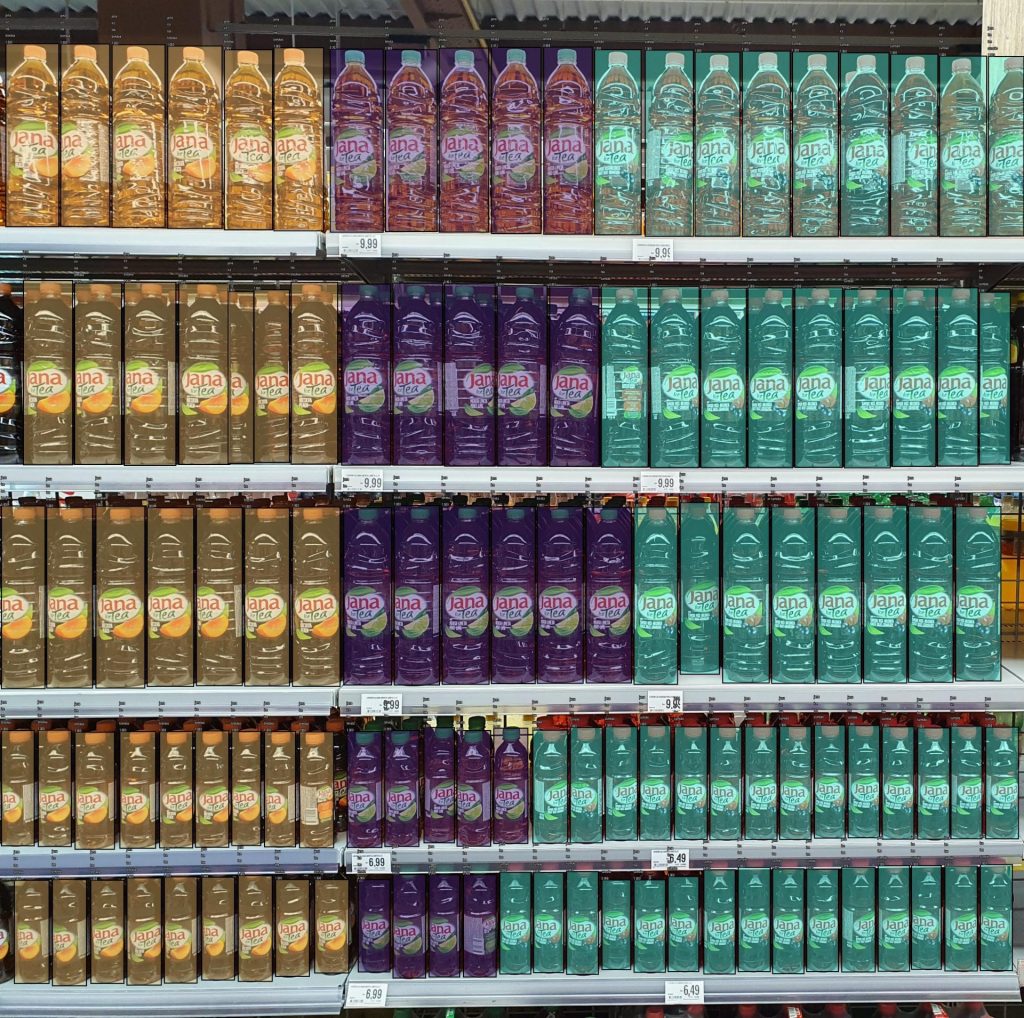
Another challenge that we encountered were the never-ending additions to the product assortment. At the beginning of development, we had only 10 different products in the fizzy drinks category. Since then, we have added over 1000 products. Categories we have collected so far are fizzy drinks, ice teas, powdered drinks, pates, spiced ham and coffee. During our research and development we implemented a lot of popular and current ideas from numerous scientific papers we have read. You can see the results of our research, development and hard work in the pictures below.
Conclusion
Although we are happy with the progress we have made so far we are looking forward to implementing some of these new features:
- determining which way the label of the product is facing
- price detection
- matching prices and products
- generating 3D visuals of the the store shelf layout
And of course, fine tuning the solutions we have implemented thus far.
Going forward, we will also add more products into our data collection to try to appeal to a wider set of manufacturers. We are also planning on expanding not only to the local market but the global market as well. And we are sure that with our many plans to expand and improve we will encounter new difficulties and obstacles, but we are eager to dive into new areas of research and development.