Blog ENG
Neo4j for Retail
In our last blog post Neo4j for Telecoms we showed some examples of the usage of graph databases in the telecommunications industry. In this blog post, we will take a peek into the world of retail and discover how graph databases can help in personalizing a customer’s purchase or in analyzing the supply chain. But first, let us recall what is a graph database.
Graph databases
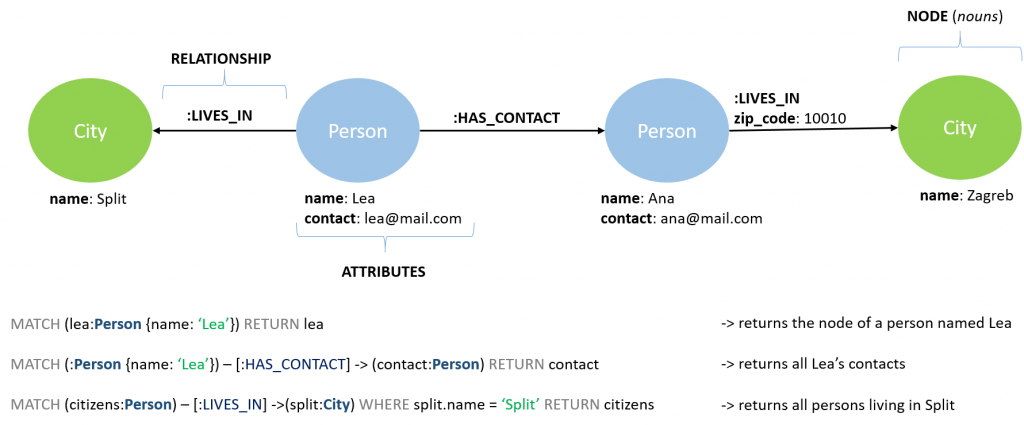
Graph databases are a type of NoSQL Databases that is characterized by storing and displaying data in graph form. Graphs consist of interconnected nodes and are a great solution for systems with a large amount of highly interconnected data.
The most widespread graph database today is Neo4j, which is an open-source database that is also compliant with ACID principles for data storage and processing, in order to give systems maximum security and efficiency when performing complex transactions.
Retail and commerce
Today’s sales, i.e. the sales of the modern age, are facing a new challenge that is becoming more and more complex. Due to low costs and large quantities of products, internet giants like Amazon can deliver products faster at a lower price than smaller retailers. To remain relevant, retailers must have real-time control over their warehouses, payments, and delivery systems. But also, to keep up with the challenges that come, especially with online commerce, it is important for them to modernize their outdated, legacy systems with new, more convenient solutions. Therefore, in this blog we will show a couple of ways how retailers and others solve their problems using graph databases.
Personalized product recommendation and promotion
It has been proven that real-time product recommendation in online shopping is a successful way to increase revenue, but also customer satisfaction. It is important to emphasize that customers expect good recommendations and are very critical of unrelated and bad recommendations. For example, a customer will certainly not be satisfied if he is recommended a product he has already bought. Therefore, recommendations must be personalized and must be based on individual preferences, purchase history, current shopping cart, customer interests and needs.
Principle of implementation
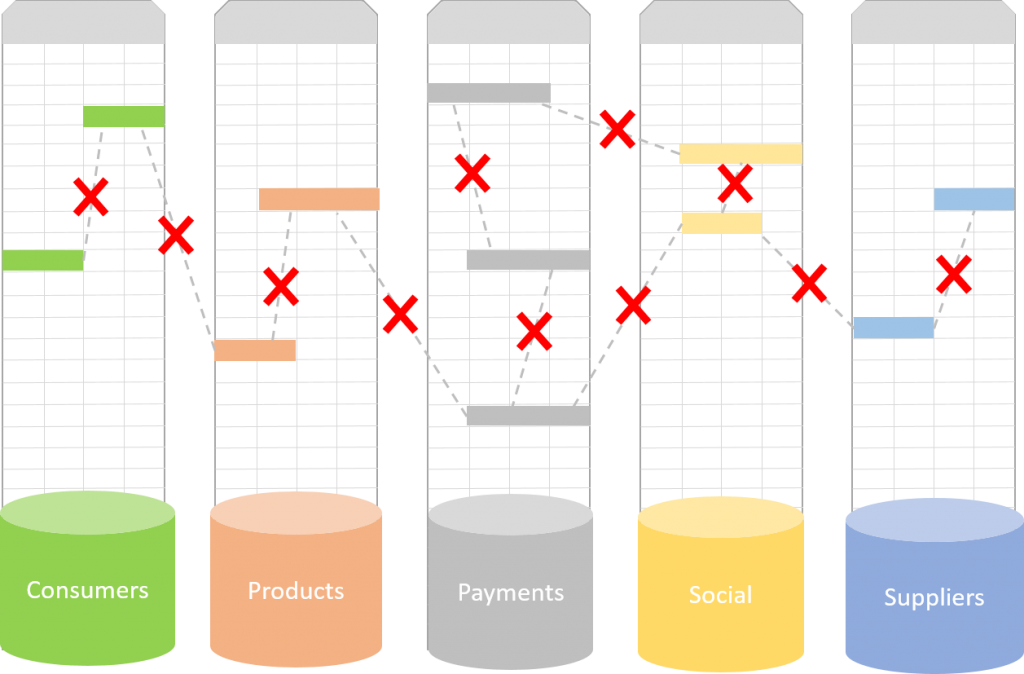
Real-time recommendations require data that is linked to numerous and complex products and customer data to gain insight into customer preferences and trends among products. On the technical side, this cannot be achieved by a traditional approach as this would require very complex queries with numerous joins, which would reduce the performance of such a real-time system.
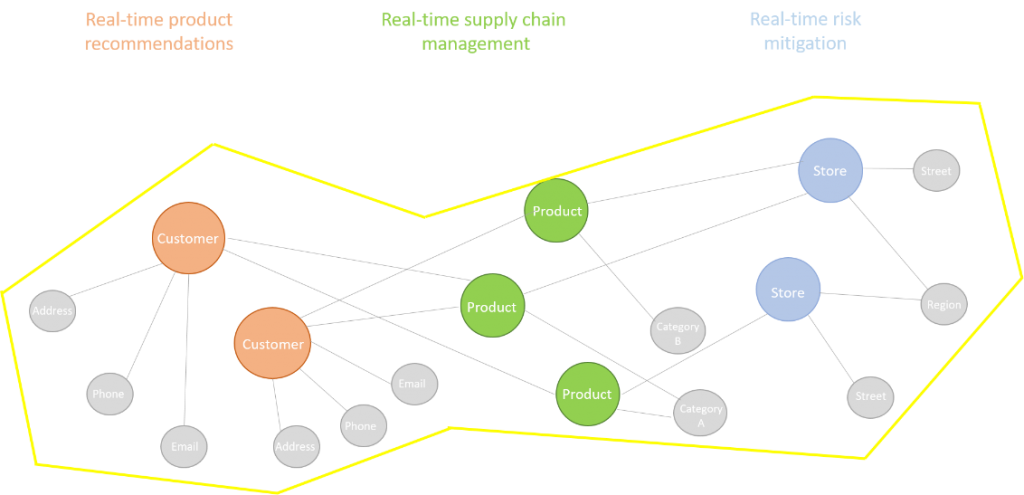
By its very design, graph databases allow you to quickly search for past customer orders, as well as obtain new information about new customer interests during their current visit to the online store. The reason for this lies in the characteristic of graph databases where relationships between data are treated as first-class entities, which means that they gain the same importance as tables in relational systems. This principle allows retailers to quickly combine past and present interests, i.e. customer information, and thus present them with personalized recommendations.
Business use-case
One of the top 10 U.S. retailers turned to Neo4j after its system nearly crashed due to excessive traffic from online shoppers during a consumer day known as Cypher Monday in 2015. The system was implemented on a relational database and on Cyber Monday they offered a 15% discount on online shopping. They successfully attracted more customers than the competition, but even though the site worked, 90% of the user traffic was delayed. The main problem was in the functionality that invited customers to add last-minute additional products to their already selected cart.
In order to recommend the right product to each customer, a system was used which analyzed past user purchases and the current shopping cart and linked this data to 15-30 layers of data, such as promotion types, product names, manufacturers, categories, etc., all in real time. Since such a system was implemented with a relational database, it was simply not adequate to perform such a task, and switching to a graph database was a logical choice that prevented a recurrence of this problem.
Graphs for e-commerce delivery services
Online shopping has gained momentum in the last decade, and it certainly peaked at the start of the recent global pandemic. People who used to be more skeptical about this way of shopping are more open to it today. Both retailers and delivery services had to adjust to the speed and quantity of products sold. In addition, mutual competition puts a lot of pressure on such services, as nowadays a customer can order a shipment from anywhere in the world, but the delivery time of the shipment greatly affects its satisfaction.
In order to shorten delivery times, retailers should have an insight into stocks in warehouses and distribution centers, as well as transit networks. They must have information on whether a routing problem will affect the delay of the shipment coming from the distribution center closest to the customer or whether this will be caused from a lack of products in stock.
Principle of implementation
Due to its high interconnectedness, data for the delivery of e-commerce can naturally be displayed as a graph, making it an ideal candidate for the use of graph databases. The reason for this is not only the high interconnectedness of the data but also the need to follow different paths that can have permutations. They can be optimized to find the best delivery routes depending on the day of the year and the products themselves.
Business use-case
One of the world’s largest e-commerce companies, eBay, has decided to move to the Neo4j graph database to manage the delivery service. They decided to do so after their existing system, based on relational databases, could no longer cope with the growing traffic, which made their popular services such as same-day delivery suffer as well. The new solution, based on graph databases, is up to thousand times faster and all this is achieved by queries that require 10 to 100 times less code than in the previous system.
Supply chain management
Today’s supply chains are large and extremely complex, which makes them very suitable for various risks such as fraud, contamination, uncertain or even unknown sources of raw materials. If such a failure occurs, it is important to react in time and detect all affected parts of the supply chain. Also, most producers know only their direct suppliers and have little or no information about the origins of other raw materials that their product contains.
Principle of implementation
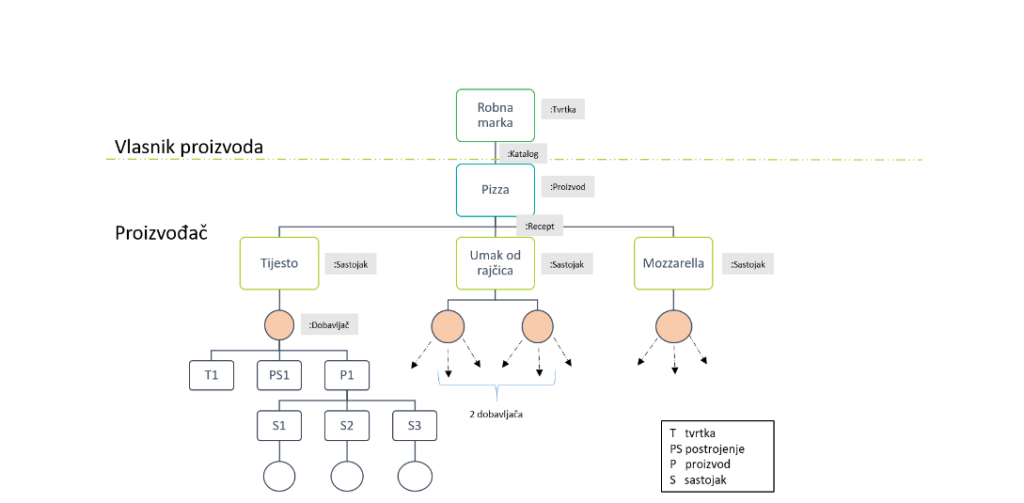
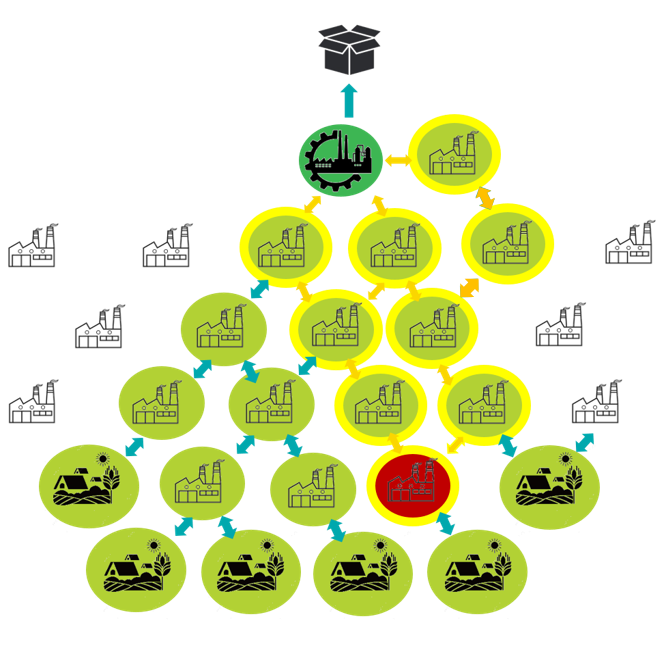
In the example of the previous figure, we can see what a part of such a chain would look like and why we would choose a graph database to solve this problem. The picture shows one brand of pizza consisting of three ingredients: dough, tomato sauce and mozzarella. Each of the ingredients has its own supplier, and may have more than one (e.g. tomato sauce). The dough consists of several ingredients, so the dough manufacturer often has to get the necessary ingredients from other suppliers. This kind of hierarchy can be descended into many levels, and we need a system that will easily spot connections between all levels and within them.
Business use-case
Precisely for the previously mentioned reasons of non-transparency of supply chains, there is a need for a platform that will enable transparency, analysis and easy search of all stakeholders in the supply chain for both producers and end consumers. One such platform is called Transparency One and its name indicates the most important aspect of its functionality – transparency. Through the platform, it is possible to obtain detailed information about all suppliers and manufactures, and information such as:
- whether all stakeholders in the chain meet certain norms and standard,
- whether a particular brand uses raw materials imported from countries where there is a problem with pollution
Although the initial implementation started using relational databases, it quickly proved to be complex and inefficient. SQL queries became very complicated and they actually performed graph table searches using expensive joins. Therefore, switching to a graph database proved to be a logical choice that allowed them to easily match simple queries that return supply chain information in an instant.
Interested in more information about graph databases? Feel free to read our other blogs related to the series Graph databases and Neo4j, like Neo4j for Telecoms or Community detection at Eurovision.
References:
[1] Philip Rathle, Driving Innovation in Retail with Graphs, How Top Retailers Use Neo4j, https://neo4j.com/whitepapers/retailers-graph-technology-neo4j/?ref=solutions,
[2] Transparency-One, Transparency-One Offers Total Supply Chain Transparency to Large Retailers and Manufacturers with Neo4j, case study: www.neo4j.com