News
Reports on the Fly
Hichert – Faisst Institute’s International business communication standards (IBCS) is a set of guidelines for developing reports, visualizations and business applications. Their purpose is to unify business data in order to communicate their content to all stakeholders in a simple and professional manner. These guidelines are more and more accepted by controlling and finance experts in their everyday tasks. By recognizing the need for rapid drafting of reports that follow mentioned standards, we have developed a set of custom reports on IBM Cognos Analytics platform.
Advantages of using Reports on the Fly
Speed and simplicity:
- In a few simple steps you can have complete powerful reports
- Chart and table combinations come prearranged, and no time is wasted aligning them
- Reports do not need to be stylized because all visual definitions are predetermined and already applied
At this time, we are offering following reports:
- Bar Chart – Tabular overview of KPI-s grouped according to your preference. Deltas are shown in the report, and you determine the type of calculation used in them.
- Calculated bar chart – Tabular overview of KPI-s grouped according to your preference with shown deltas calculated in advance.
- Waterfall – Graphic cumulative overview of KPI-s grouped by your preference.
- Calculated waterfall – Graphic cumulative overview of KPI-s grouped by your preference with shown deltas that are calculated in advance.
- Negative waterfall – Comparative graphical representation of your income statement items between two periods.
- Negative waterfall calculated – Comparative graphical representation of your income statement items between two periods with shown deltas that are calculated in advance.
- Merged bar chart – It graphically compares 3 different KPI-s in a way that it compares the period of last year with the period of the current one and continues with the business plan where current year ends.
- Calculated merged bar chart – It graphically compares 3 different KPI-s in a way that it compares the period of last year with the period of the current one and continues with the calculated forecast where current year ends.
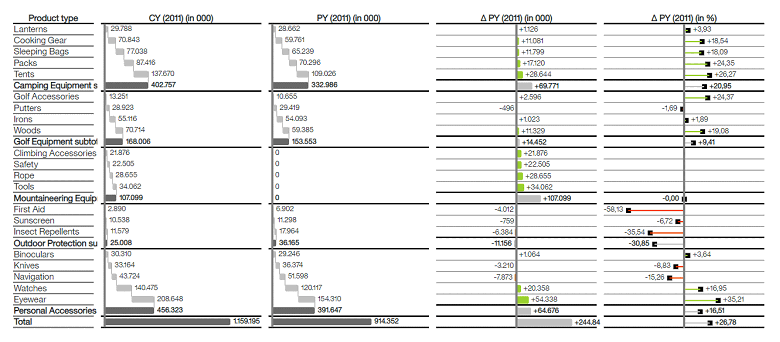
- Bart chart
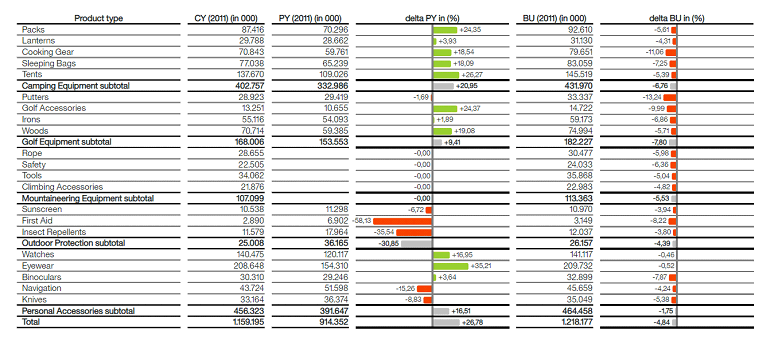
The report is used to show and compare three different values for a particular category. The category and values are presented in tabular form, while the comparisons of the first with the second and the first with the third value are shown graphically. To create a report, the desired category, three values to compare and the desired comparison calculation are needed. Optionally, we can add a category that will be used for grouping and calculation of subtotals, and a category by which we want to sort the displayed data.
2. Calculated bar chart
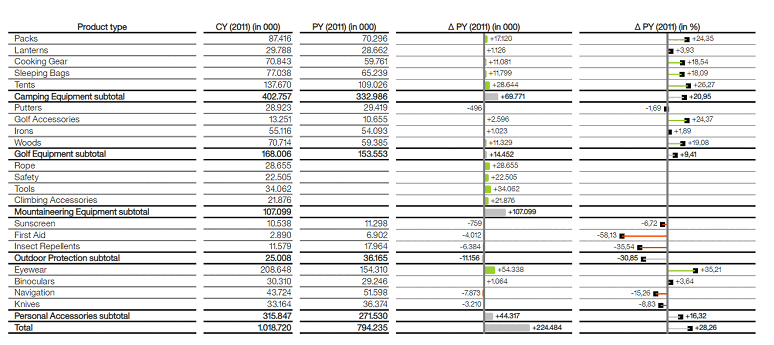
The report is used to show and compare two different values for a particular category. The category and values are shown in tabular form while the comparisons of the first with the second value are shown graphically. To create a report, we need the desired category and values to compare. The comparison calculation for the graphs is that the former gives us the absolute delta while the latter gives us the percentage delta. Optionally, we can add a category that will be used for grouping and calculation of subtotals, and a category by which we want to sort the displayed data.
3. Waterfall
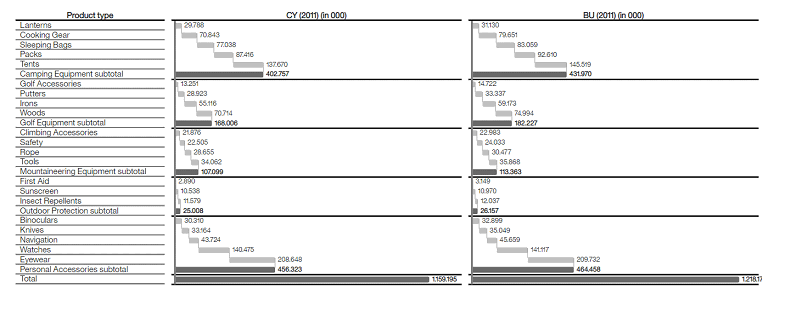
The report is used to display two different values for a particular category. The category is displayed in tabular form while the values are displayed graphically. To create a report, we need the desired category and values to compare. Optionally, we can add a category that will be used for grouping and calculation of subtotals, and a category by which we want to sort the displayed data.
4. Calculated waterfall
The report is used to show and compare two different values for a particular category. The category is presented in tabular form while the values and comparisons are shown graphically. To create a report, we need the desired category and values to compare. The comparison calculation for the graphs is that the former gives us the absolute delta while the latter gives us the percentage delta. Optionally, we can add a category that will be used for grouping and calculation of subtotals, and a category by which we want to sort the displayed data.
5. Negative waterfall
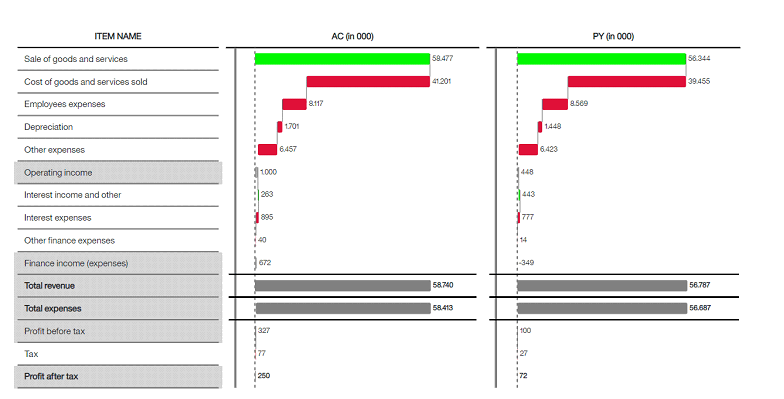
The report serves to show us two periods of the income statement. To prepare the report, we need income statement items, their names, a category that will show whether the value of the item is positive or negative, a category that will show whether the item is independent or cumulative, and item values for both periods.
6. Calculated negative waterfall
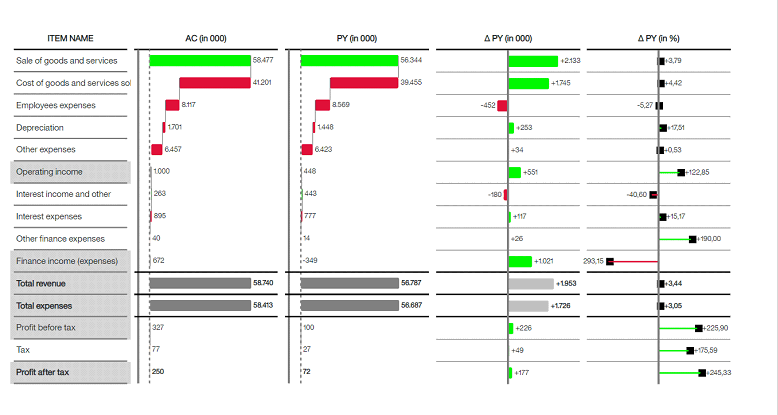
The report serves to show and compare the two income statement periods. To prepare the report, we need income statement items, their names, a category that will show whether the value of the item is positive or negative, a category that will show whether the item is independent or cumulative, and item values for both periods. The comparison calculation for the graphs is that the former gives us the absolute delta while the latter gives us the percentage delta.
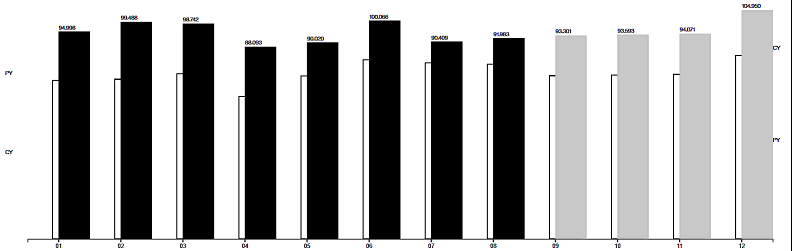
7. Merged bar chart
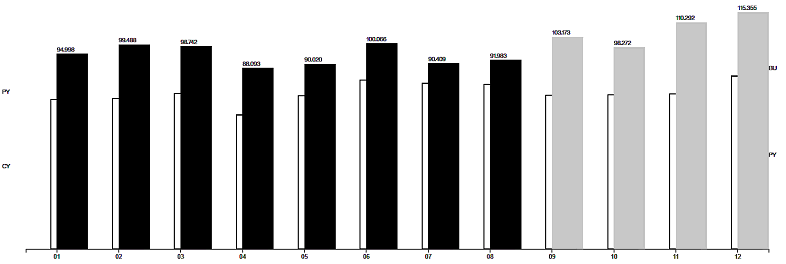
The report is used to show values on an annual basis by months. Last year’s values are displayed transparently in the background, current year’s values are shown in black columns from the beginning of the graph to the last month for which we have data, and then gray columns continue to show plan values for the current year. To prepare the report, we need the desired values for the last year, the current year and the plan for the current year.
8. Calculated merged bar chart
The report is used to show values on an annual basis by months. Last year’s values are displayed transparently in the background, current year values are shown in black columns from the beginning of the graph to the last month for which we have data, and then gray columns continue to show calculated current year trend values obtained from last and current year data. To create a report, we need the desired values for last year and the current year.
For more information contact us at tel. +385 1 4091 300 or e-mail: poslovna.rjesenja@megatrend.com